Hoover's unemployment rate was 2.9% in August, up from 2.2% a year earlier, with 920 fewer residents working. Alabama was at 3.6% and Birmingham at 4.5%.
Hoover’s unemployment rate was 2.9% in August, according to preliminary figures from the U.S. Bureau of Labor Statistics. A year earlier it was 2.2%.
About 1,442 Hoover residents were out of work and looking for a job in August. That is 331 more than in August 2025.
The number of residents with a job fell by 920 over the same year, to 47,860.
The figures come from the bureau’s Local Area Unemployment Statistics for Hoover, which count where people live, not where they work. They are not seasonally adjusted, so the fair comparison is with the same month a year earlier.
How Hoover compares
Hoover’s rate is still lower than Alabama’s, Jefferson County’s and the nation’s. But the rate rose across the whole area over the past year.
| Place | August 2026 | August 2025 |
|---|---|---|
| Vestavia Hills | 2.6% | 2.0% |
| Homewood | 2.7% | 2.2% |
| Shelby County | 2.8% | 2.3% |
| Hoover | 2.9% | 2.2% |
| Alabama | 3.6% | 3.0% |
| Jefferson County | 3.8% | 3.1% |
| United States | 4.3% | 4.5% |
| Birmingham | 4.5% | 3.8% |
Every place in the table rose except the nation as a whole, whose rate fell. Homewood is about six miles north of Hoover, Vestavia Hills about seven miles east and Birmingham about 10 miles northeast.
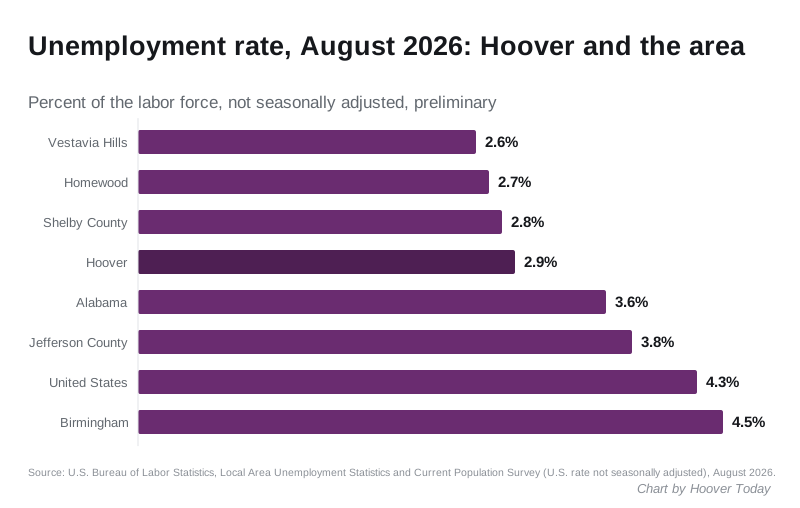
The county, state and city rates come from the bureau’s local series for Jefferson County, Shelby County, Alabama, Birmingham, Homewood and Vestavia Hills. The U.S. figure is the national rate without seasonal adjustment, so it compares like with like.
The year so far
Hoover’s rate has moved through 2026 like this, according to the bureau:
| Month | Rate | Residents out of work |
|---|---|---|
| January | 2.2% | 1,074 |
| February | 2.4% | 1,204 |
| March | 2.1% | 1,063 |
| April | 2.0% | 967 |
| May | 2.6% | 1,291 |
| June | 3.0% | 1,506 |
| July | 2.9% | 1,455 |
| August | 2.9% | 1,442 |
Because the figures are not seasonally adjusted, a change from one month to the next can be a seasonal pattern, not a trend. The year-over-year change is the better guide.
Hoover’s labor force, the residents working or looking for work, was 49,302 in August. That is 589 fewer than a year earlier.
What it means for you
- The rise is real but small. About three in every 100 Hoover residents in the labor force were looking for work in August, against about two a year earlier.
- These are early figures. The bureau marks August as preliminary, and preliminary figures can be revised.
- Where people live, not where they work. The Hoover figures count Hoover residents, wherever their job is. They say nothing directly about jobs at Hoover businesses.
For more on Hoover’s population, incomes and households, see our Hoover population page. New openings in town are on our new businesses page.
How to read these figures
The unemployed are people without a job who looked for one in the past four weeks. People not looking, including most retirees and full-time students, are not counted either way.
The bureau’s tables carry no figure for October 2025 in any of the series in this story.
Have your say